How to calculate engagement rate on X
The short answer
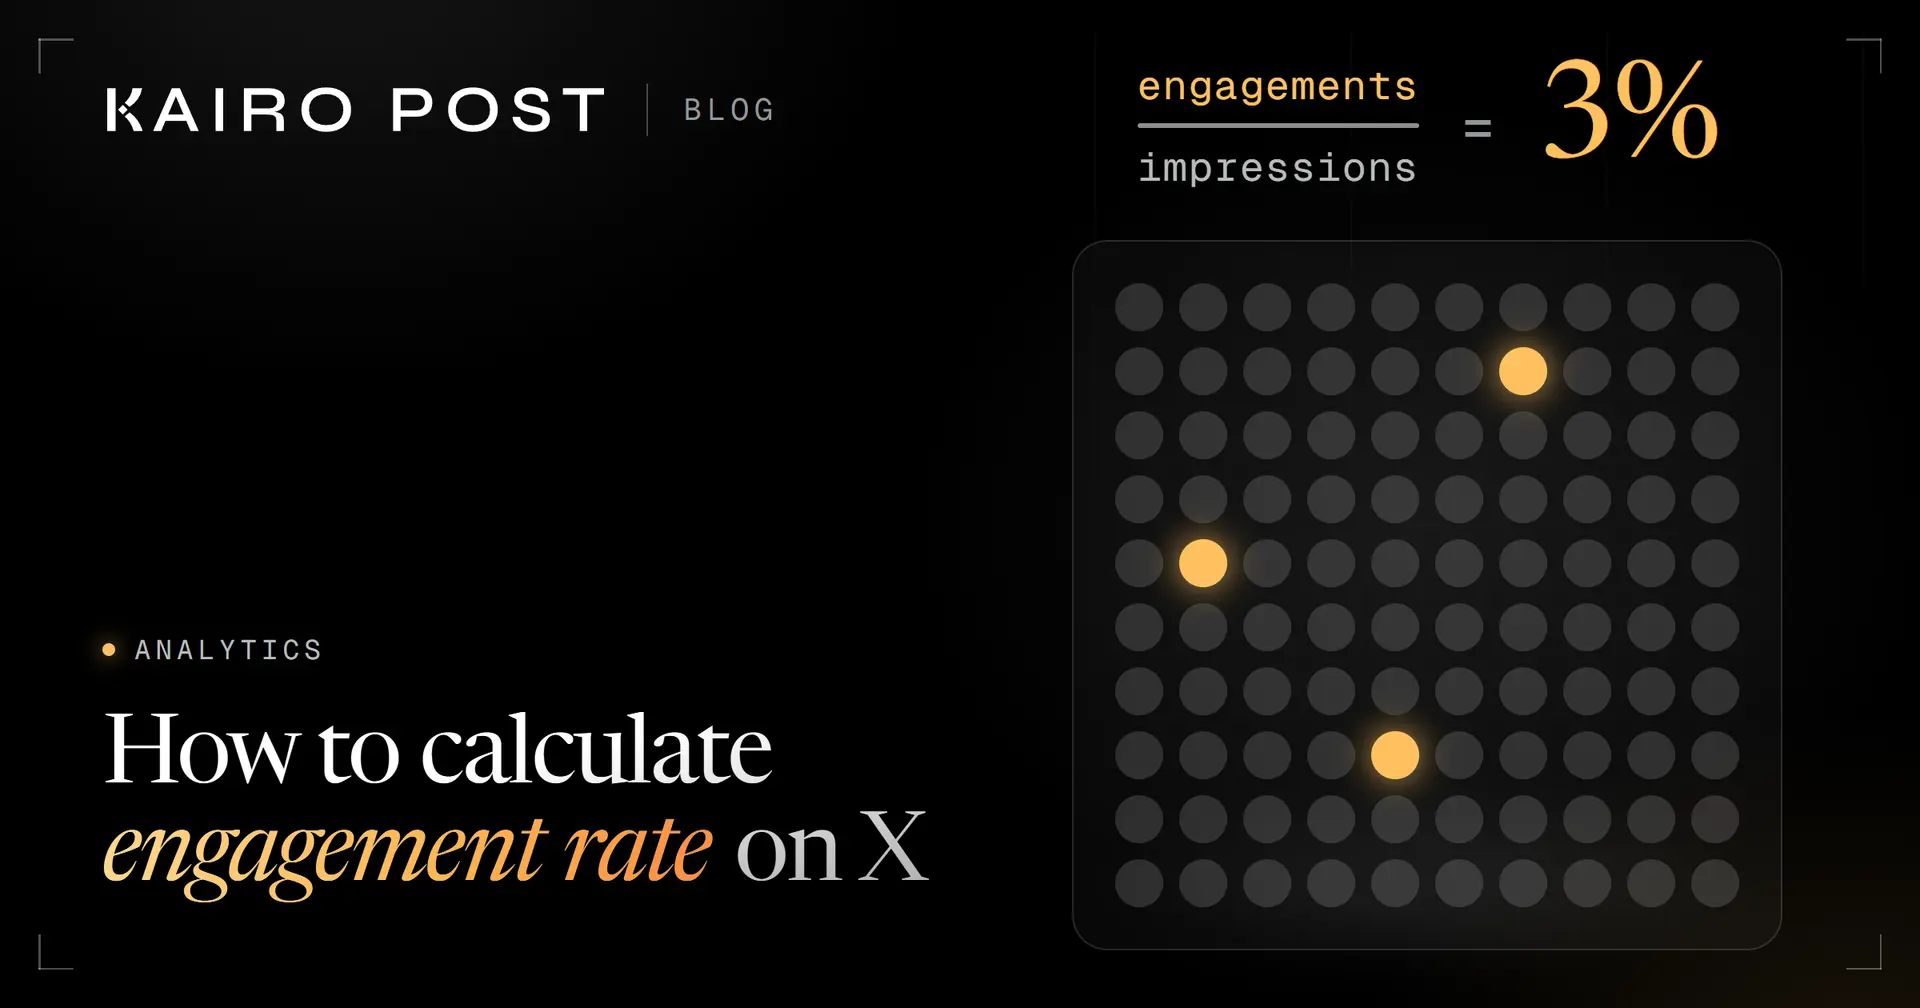
To calculate engagement rate on X, divide a post's engagements by its impressions and multiply by 100, the same two numbers X's own definition uses. Dividing by followers gives a different rate, so choose one formula and keep it.
Key takeaways
- Engagement rate on X is engagements divided by impressions, times 100.
- X's engagements total includes clicks nobody else can see, so it is bigger than the likes, replies and reposts under a post.
- Impressions are not unique: one person seeing a post twice counts as two impressions.
- Rate by impressions judges a post. Rate by followers only compares accounts when impressions are missing.
- Write the formula and the engagement types next to every figure, and compare new posts with the median of your own recent posts.
How to calculate engagement rate on X
Open the post's analytics
Find the post and note its impressions. You need impressions and either X's engagements total or the separate counts.
Decide which engagements count
Use X's engagements total, or add the counts you choose yourself. Write the choice down.
Add up the engagements
If you chose the counts, add them. If you chose X's total, take it as it shows.
Divide by impressions and multiply by 100
Engagements divided by impressions, times 100, gives the rate by impressions.
Label the result
Write the formula and the engagement types next to the number so it can be read later.
Repeat for your recent posts
Do the same for your last 20 to 30 posts, then take the median as your baseline.
You posted something that seems to have done well, and now someone wants the engagement rate on X. You open the post's analytics and find impressions, likes, replies and a total called engagements, but no rate you can copy into a report. Many views and few reactions? See why X posts get impressions but no engagement.
The calculation is one division. What takes care is deciding what goes into each number, and writing that choice down so next month's figure means the same thing as this month's. This guide gives you the formula, X's own definitions, a worked example with made up numbers and the decisions that change the answer.
What is the formula for engagement rate on X
Engagement rate on X is a post's engagements divided by its impressions, multiplied by 100. X's own definition of engagement rate is the number of engagements divided by the number of impressions, so with X's engagements total this is the figure X itself shows.
engagement rate = engagements ÷ impressions × 100
Take a plain case. A post with 40 engagements and 1,000 impressions has a rate of 40 ÷ 1,000 × 100, which is 4%.
Everything else in this guide is about the two inputs. What you count as an engagement, and what you divide by, can move one post's rate several times over, as the worked example below shows.
What X counts as an engagement and as an impression
X defines an engagement as the total number of times someone interacted with a post. That includes clicks anywhere on the post, plus reposts, replies, follows and likes. Impressions are simpler to state and easier to misread.
That second definition matters more than it looks. Impressions count views, not people, so a rate by impressions asks one question: each time the post was shown, how often did something happen?
Some of what X counts, anyone can see. The rest only shows up in your own analytics. X's developer docs split the two like this.
| Counts anyone can see | Counts only you can see |
|---|---|
| Likes | Link clicks |
| Replies | Profile clicks |
| Reposts and quotes | Video playback milestones |
| Bookmarks and impressions | X's own engagements total |
So X's total is bigger than the likes, replies and reposts under a post. A rate you build from the visible counts alone will usually come out lower than the rate in your analytics.
How to calculate engagement rate on X, step by step
Six steps cover one post and then your whole account. Do them in order the first time, and the routine takes a minute per post after that.
X's own Post Activity Dashboard shows impressions, engagements and the engagement rate for each post, so you can check your sums against it.
Open the post's analytics
Find the post and note its impressions. You need those, and either X's engagements total or the separate counts under the post.
Decide which engagements count
Use X's engagements total, or add the counts you choose yourself, such as likes, replies, reposts and quotes. Write the choice down before you look at the result.
Add up the engagements
If you chose the counts, add them. If you chose X's total, take it as it shows.
Divide by impressions and multiply by 100
Engagements divided by impressions, times 100. In a spreadsheet with impressions in column B and engagements in column C, the rate is
=C2/B2formatted as a percentage.Label the result
Write "rate by impressions, likes, replies, reposts and quotes" next to the figure. A bare percentage cannot be compared with anything later.
Repeat for your recent posts
Do the same for your last 20 to 30 posts and take the median. That is your baseline, and the last section shows how.
A worked example with made up numbers
These figures are made up. They are the starting values in our engagement rate calculator, so you can type them in and watch it agree with the sums below.
A post gets 84 likes, 12 replies, 9 reposts, 3 quotes and 21 bookmarks. It also gets 30 link clicks and 14 profile visits, which only you can see. It had 5,420 impressions, and the account had 2,150 followers.
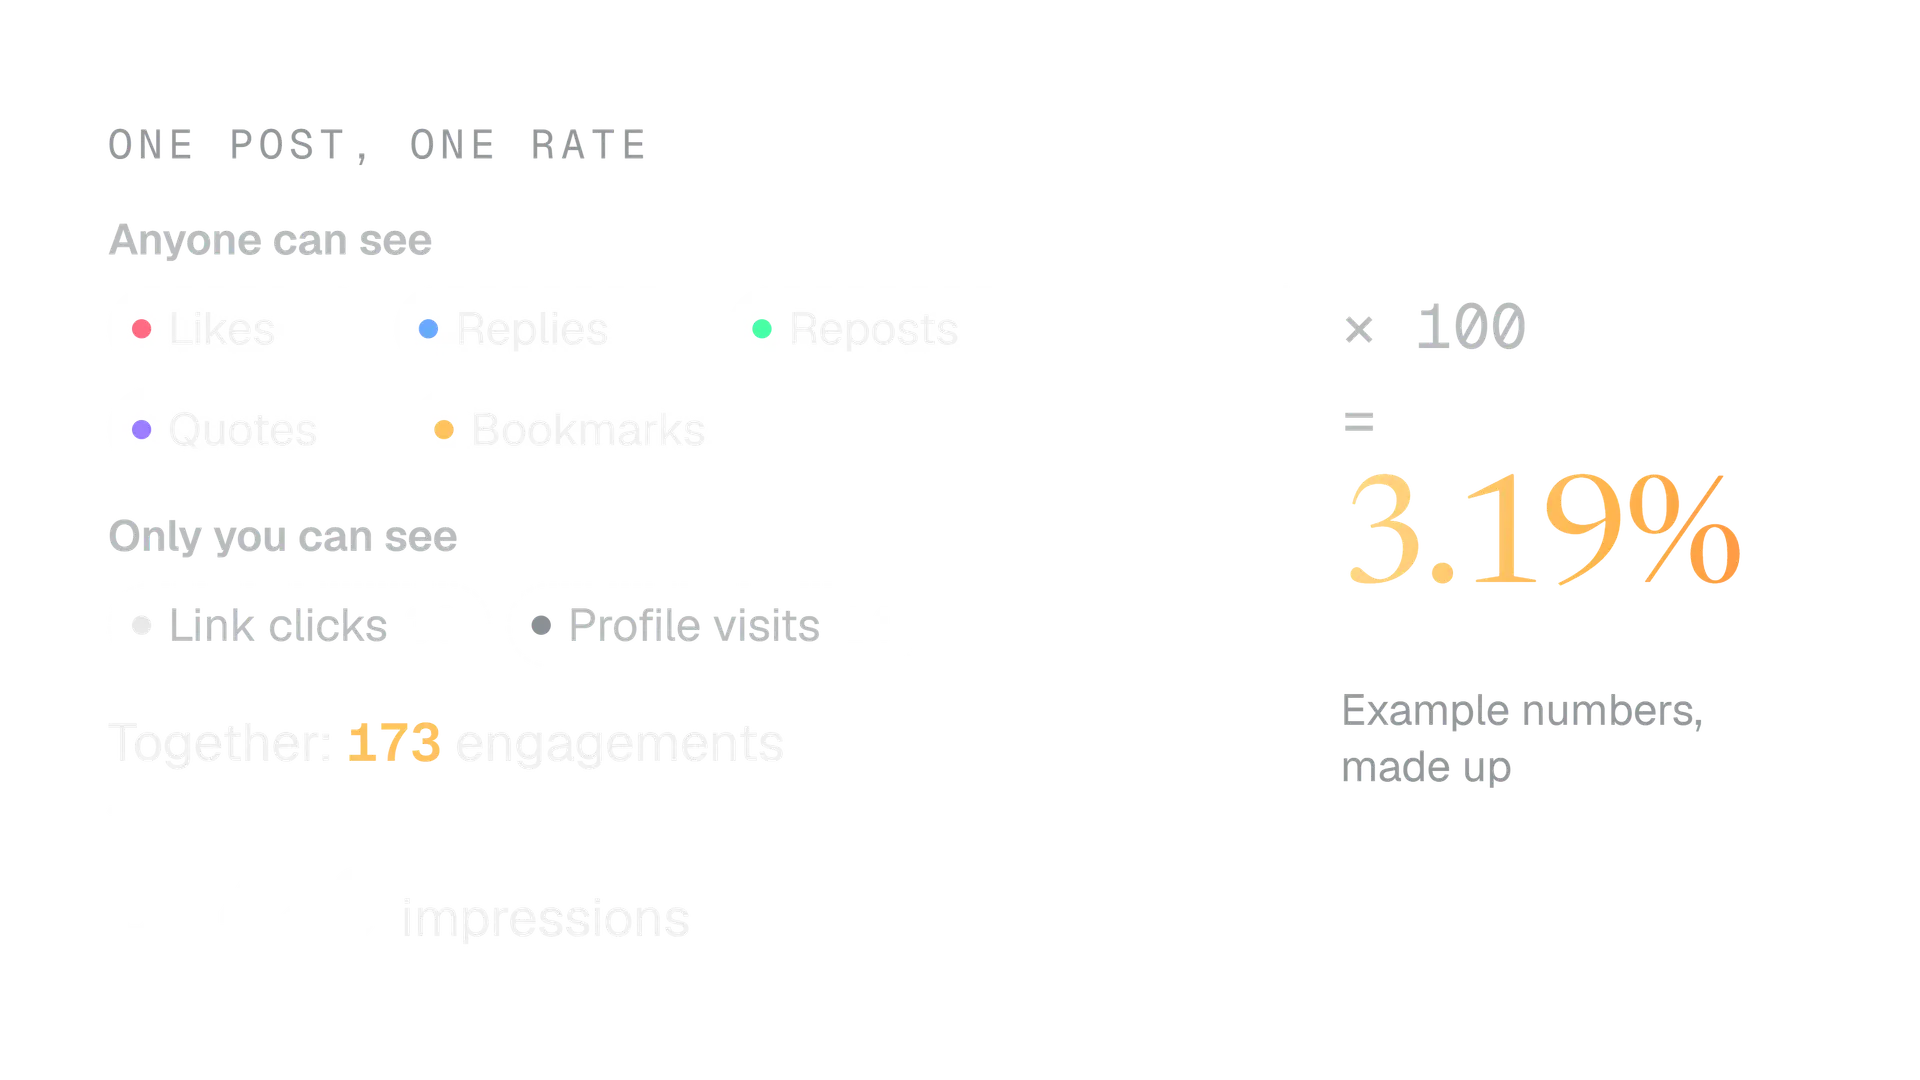
Now see how much the choice of engagements changes the answer for this one post.
| What you count | Engagements | Rate by impressions |
|---|---|---|
| Likes, replies, reposts and quotes | 108 | 1.99% |
| Add bookmarks | 129 | 2.38% |
| Add link clicks and profile visits | 173 | 3.19% |
| X's own total, if it showed 210 | 210 | 3.87% |
Same post, same day, and the rate runs from 1.99% to 3.87%. None of those is wrong. Mixing them inside one report is.
The maths and the rounding
173 ÷ 5,420 = 0.031919, and times 100 that is 3.1919, which we write as 3.19%. Round only at the end, never between steps.
Going from 2.38% to 3.19% is a rise of 0.81 percentage points. Measured against 2.38% it is a rise of about 34%. Say which one you mean, because they sound alike and are very different numbers.
Engagement rate by impressions or by followers
Use impressions to judge a post and followers only when you do not have impressions. Divide the same 173 engagements by the 2,150 followers and you get 8.05% instead of 3.19%.
Neither is a mistake, but they answer different questions.
| By impressions | By followers |
|---|---|
| Divides by the times the post was shown | Divides by the people who follow you |
| Asks: when it was shown, how often did people act? | Asks: how much activity for this audience size? |
| Needs impressions from the post's analytics | Needs only a follower count |
| Stays comparable when a post travels beyond followers | Can pass 100% when it travels |
If engagements outnumber followers, the rate passes 100%. That is not an error. It means people beyond your followers acted on the post.
If you do use followers, take the count from the day you posted, because it changes. And never put a rate by followers and a rate by impressions in the same column.
Which engagement types should you include
Include whichever set you will keep using, and keep using it. The right set is the one you can repeat for every post, every month.
Pick one set and keep it
Write the set at the top of your sheet, for example likes, replies, reposts, quotes and bookmarks. Use it for every post and every month.
Change the set when a number looks low
Adding link clicks to one month's report makes that month look better and makes the trend meaningless.
There are two honest routes, and each has a catch.
- X's total. It matches the figure on X's screen and includes clicks others cannot see. You can only get it for accounts you run.
- Public counts. The rate is lower, but it works for any post whose counts are public, including someone else's. It leaves out private clicks.
How to get one number for a month or an account
A single post gives you a rate. A month of posts gives you a choice of four versions, and each answers a different question.
One post
Rate by impressions
Engagements over impressions. Use it to judge a post and to test formats or times.
No impressions
Rate by followers
Engagements over followers. Use it to compare accounts of different sizes when impressions are missing.
One month
Pooled rate
All engagements over all impressions. Use it for a monthly report. One big post dominates it.
Baseline
Median post rate
The middle value of each post's rate. Use it to know what a normal post achieves.
The tempting shortcut is to average the percentages. It gives posts with tiny reach the same weight as posts seen by thousands.
Pool the counts, then divide once. The pooled rate is the one for a monthly total, and the median is the one for a normal post.
How to find your own baseline instead of chasing a benchmark
Your baseline is the median rate of your own recent posts, worked out with one formula every time. We think it beats a published average, which comes from other people's accounts and a formula you often cannot see.
- Take your last 20 to 30 posts.
- Work out each post's rate by impressions with the same engagement set.
- Sort the rates and take the middle one. That is your median.
- Note the middle half of the values, from the 25th to the 75th percentile. That is your ordinary range.
- Judge a new post against both: above the median is good, above the top of the middle half is a clear win.
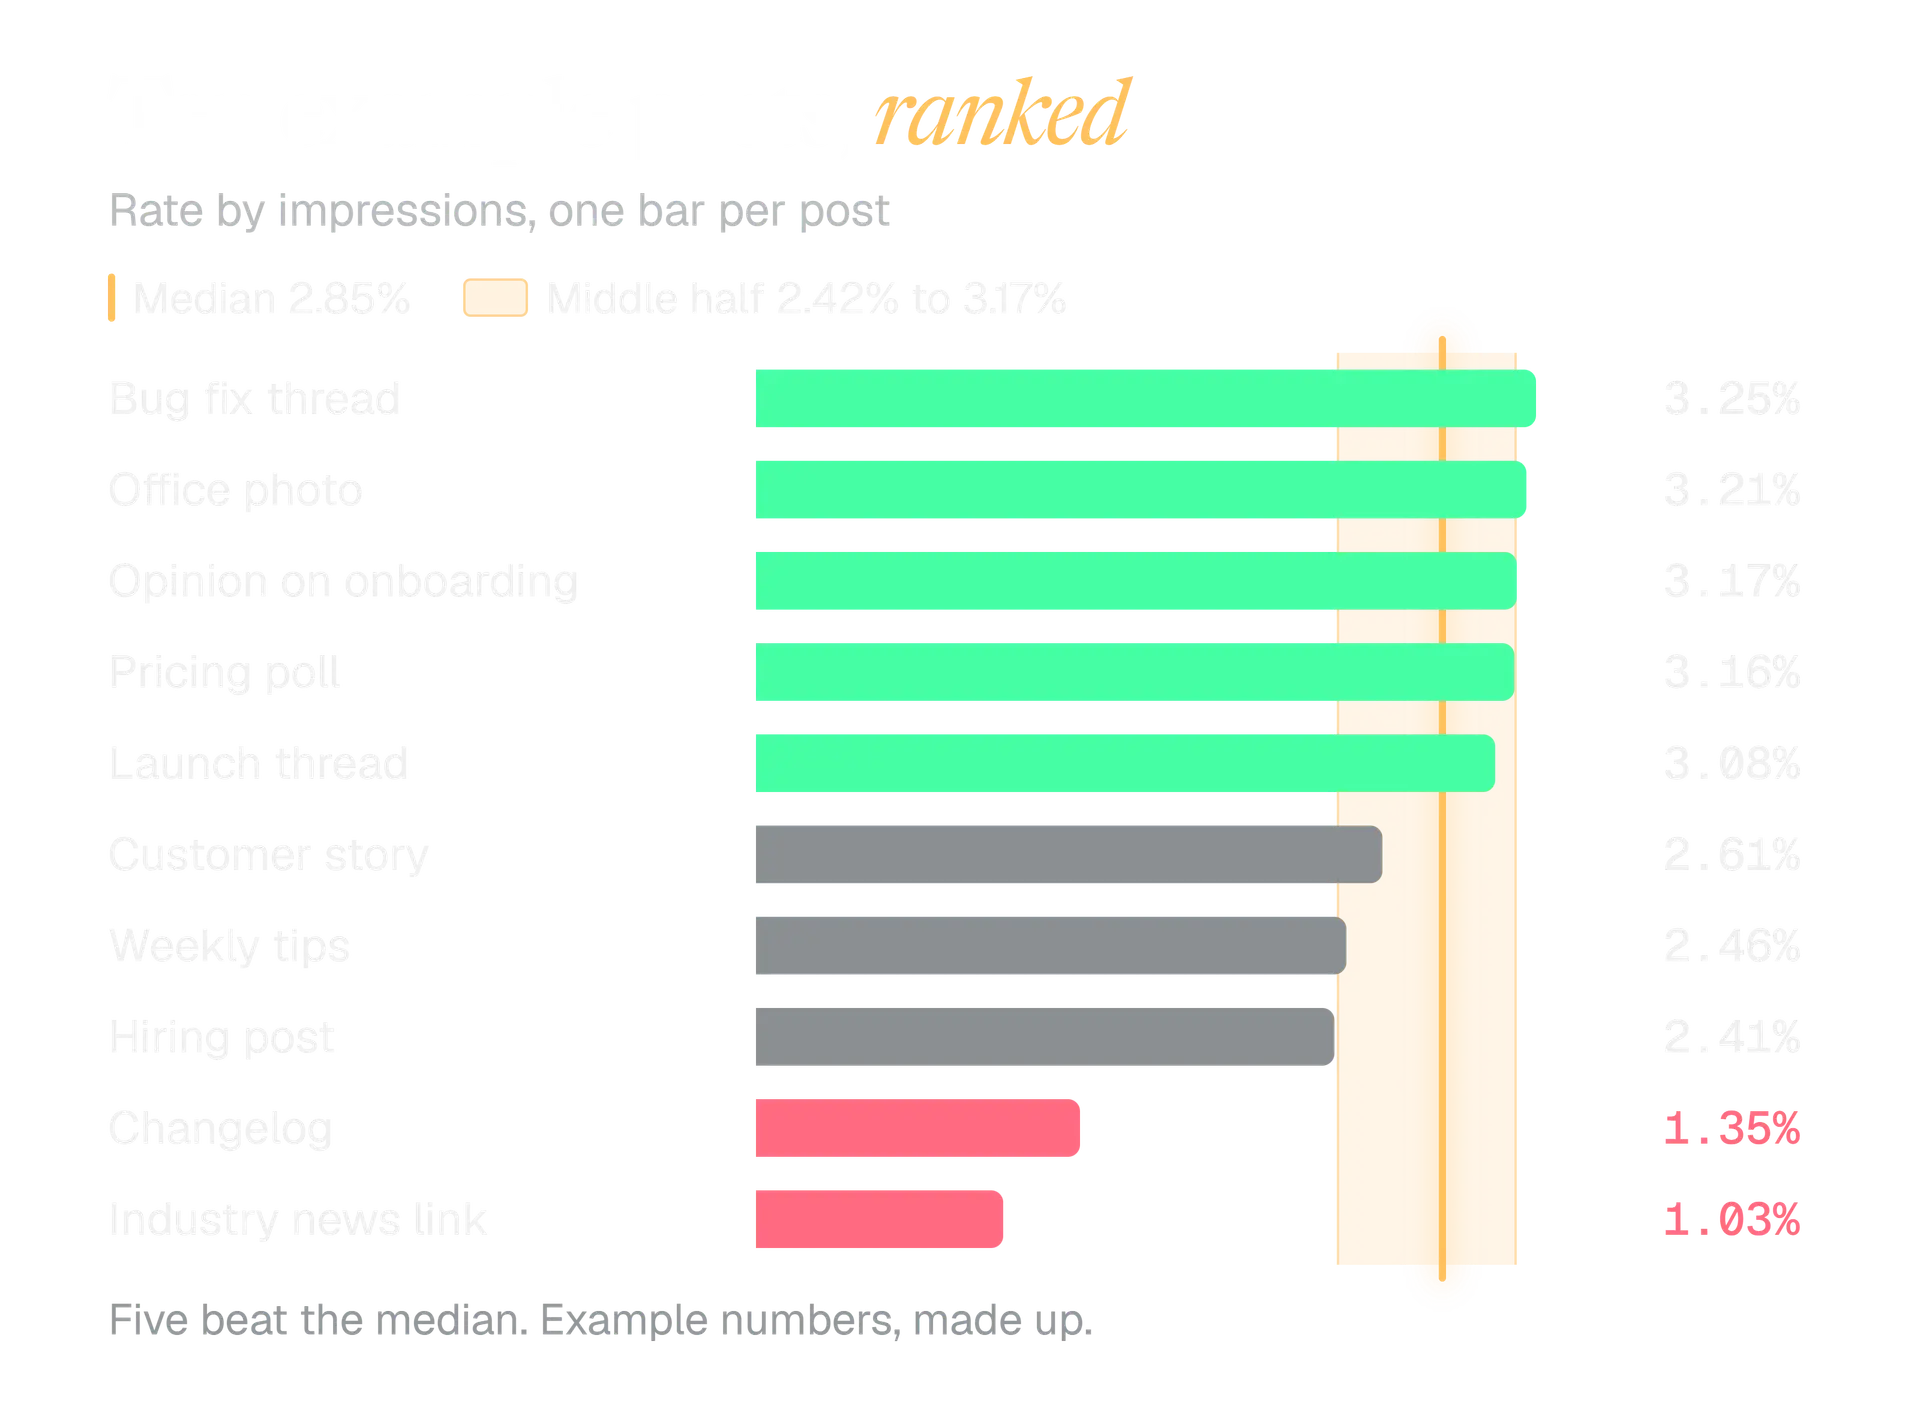
Ten posts is too few to trust in real life. The figures are here to show the shape. With 20 to 30 posts the median settles, and it ignores the one post that went far.
You can do the sorting in a spreadsheet, or paste a table of posts into the Account baseline tab of the engagement rate calculator. Refresh it every month or two, since your normal moves as your audience does.
Can you work out the engagement rate of someone else's account
Yes, but only from public counts, and the result is not the rate in the owner's analytics. X's developer docs list impressions, likes, replies, reposts, quotes and bookmarks as public metrics. Clicks, profile clicks and X's own engagements total are not public.
So for a post on another account the formula is public engagements divided by public impressions, times 100. It will usually come out lower than the owner's own figure, because the private clicks are missing.
| Your own post | Someone else's post |
|---|---|
| Can use X's engagements total | Public counts only |
| Includes link clicks and profile clicks | Leaves private clicks out |
| Compare with your own median | Compare only with other public counts |
The last row is the one people skip. Put a rate from public counts next to a rate from X's total and one of them is measuring something the other cannot see. If you are checking a competitor, rebuild your own post's rate from public counts too, so the two match.
How to write the rate in a report so nobody argues with it
A figure without its recipe starts a debate. Put five small facts beside every engagement rate and the debate rarely starts.
| Write this | Example (made up) |
|---|---|
| The formula | Rate by impressions |
| The engagement types | Likes, replies, reposts, quotes, bookmarks |
| The age of the posts | Measured 7 days after posting |
| The sample | 24 posts from 1 to 30 September |
| The comparison | Median of the previous 24 posts |
Median rate by impressions, 7 days after posting, likes, replies, reposts, quotes and bookmarks: 2.9% across 24 posts.
That one line carries everything a reader needs to repeat the number. It is also what makes next month's report comparable with this one. If you send reports for clients, what to put in a monthly X report covers the rest of the page.
Mistakes that make engagement rate misleading
Most bad engagement rate figures come from a small set of habits. These are the ones we would check first.
- Mixing formulas. A rate by followers and a rate by impressions in one table cannot be compared.
- Changing the engagement set. Adding a type halfway through the quarter breaks the trend.
- Judging posts at different ages. Impressions keep arriving after you post. We pick one age, such as 7 days, and measure every post then.
- Trusting tiny samples. On 90 impressions, one extra like moves the rate by more than a point.
- Averaging percentages. Pool the counts, or use the median.
- Counting your own activity. Take your own replies out of the count where you can see them, because they inflate small posts.
- Treating a benchmark as a target. A number from someone else's account cannot tell you what your audience responds to.
The API adds one more. Non public, organic and promoted metrics are only available for posts created within the last 30 days, so a report built later cannot rebuild an old post's clicks. Save the figures while you can.
Your next step
Work out the rate for one recent post, then write its formula next to it. After that, repeat it for your last 20 to 30 posts and keep the median.
Before you share an engagement rate
- The formula and the engagement types are written next to the number.
- Every post in the comparison used the same engagement set.
- Impressions come from the same place for every post.
- Posts are measured at the same age.
- Each post has enough impressions that one like does not swing the rate.
- You compared against your own median, not a stranger's average.
If you would rather not keep a spreadsheet, Kairo Post's analytics read post metrics from the official X API and can save a daily or weekly report as a private file. The engagement rate calculator stays free and runs in your browser.
In the product
How Kairo Post does this
Everything above works by hand. Kairo Post does the same work for you, with your approval before anything goes out.
Questions people ask
What is a good engagement rate on X?
Why is my engagement rate by followers over 100%?
Does X count bookmarks as engagements?
When should I measure the engagement rate of a post?
Can I get engagement rate from the X API?
Sources
Every rule, limit and figure in this post was checked against these on the date shown.
- Post and Video Activity Dashboards, X Business Help
business.x.com · checked
- X Ads glossary, X Help Center
help.x.com · checked
- Export CSV Definitions, X Help Center
help.x.com · checked
- Metrics, X Developer Platform
docs.x.com · checked
Written by