X analytics: the complete guide

The short answer
X shows analytics as account level figures, as numbers for each post in the Post Activity Dashboard (which exports a CSV), and through the API for developers. The core metrics are impressions, engagements, engagement rate, profile visits, link clicks and followers, judged against your own baseline.
Key takeaways
- Impressions count views, not people, and engagements include clicks that only you can see.
- The Post Activity Dashboard opens on the last 28 days and exports up to 30 days or 3,000 posts at a time.
- Through the API, non public metrics exist only for posts created in the last 30 days, so save your numbers on a schedule.
- Read every number at the same post age, with the same formula, against your own median.
- Tag every link, then compare X's link clicks with your site's sessions knowing the two will not match.
You open X analytics and find a dozen numbers. Impressions are up, the engagement rate is down, profile visits did something odd, and someone wants a report by Friday. Which of these numbers deserves your attention? If you report to a client, start from our monthly X report template. Two numbers deserve their own guides: vanity metrics you can ignore and what profile visits tell you.
X analytics is the set of figures X gives you about your posts and your account. This guide covers where to find them, what each metric means, what the API adds, what X does not show, and how to turn it all into a monthly report built on your own baseline. Where we could not confirm a detail from X, we say so.
Where do you find X analytics
X shows analytics in a few connected places. Which views you can open depends on your account, so check your own. These are the ones X's pages describe.
The summary
Account home
X's Ads glossary lists Account home next to the post and video dashboards as part of X Analytics. It is the account level view, so start here for the trend.
Every post
Post and Video Activity dashboards
A list of your posts with impressions, engagements and an engagement rate for each, plus a CSV export. Start here to compare posts.
For tools and code
The X API
The same kinds of counts, read by a program. Some are public for any post. The private ones are for your own posts.
After the click
Your website analytics
X can tell you someone clicked. Only your own analytics, such as GA4, can tell you what they did next.
Professional accounts add Professional Home analytics, according to X's help. Our guide to the X professional account covers what else changes when you switch.
What the main X analytics metrics mean
Six numbers cover most of what you need: impressions, engagements, engagement rate, profile visits, link clicks and followers. Each answers a different question, and none of them answers all of them. To keep link tags consistent across people and campaigns, use our UTM naming conventions.
| Metric | What it counts | The question it answers | Watch out for |
|---|---|---|---|
| Impressions | Times the post appeared on a user's screen | How often was it shown? | Views, not people. One person seeing it twice is two |
| Engagements | Every interaction: clicks anywhere on the post, reposts, replies, follows, likes | How much did people do with it? | Includes clicks only you can see |
| Engagement rate | Engagements divided by impressions | Of the times it was shown, how often did something happen? | Only comparable if you use one formula |
| Profile visits | Visits to your profile, shown in your account analytics | Did the post make people look at you? | Not the same as new followers |
| Link clicks | Clicks on a URL in the post | Did people leave for your site? | Clicks are not visits on your site |
| Followers | The running total of accounts that follow you | Is the audience growing? | A total, so save it to see change |
These definitions come from X's own pages: its developer docs for impressions, its Export CSV Definitions for engagements and link clicks, and its Ads glossary for engagement rate. For the wider vocabulary, see our X glossary.
The one that causes most confusion is engagements. It is bigger than the likes, replies and reposts you can see under a post, because it also counts clicks on the post, on media, on your name and on your photo.
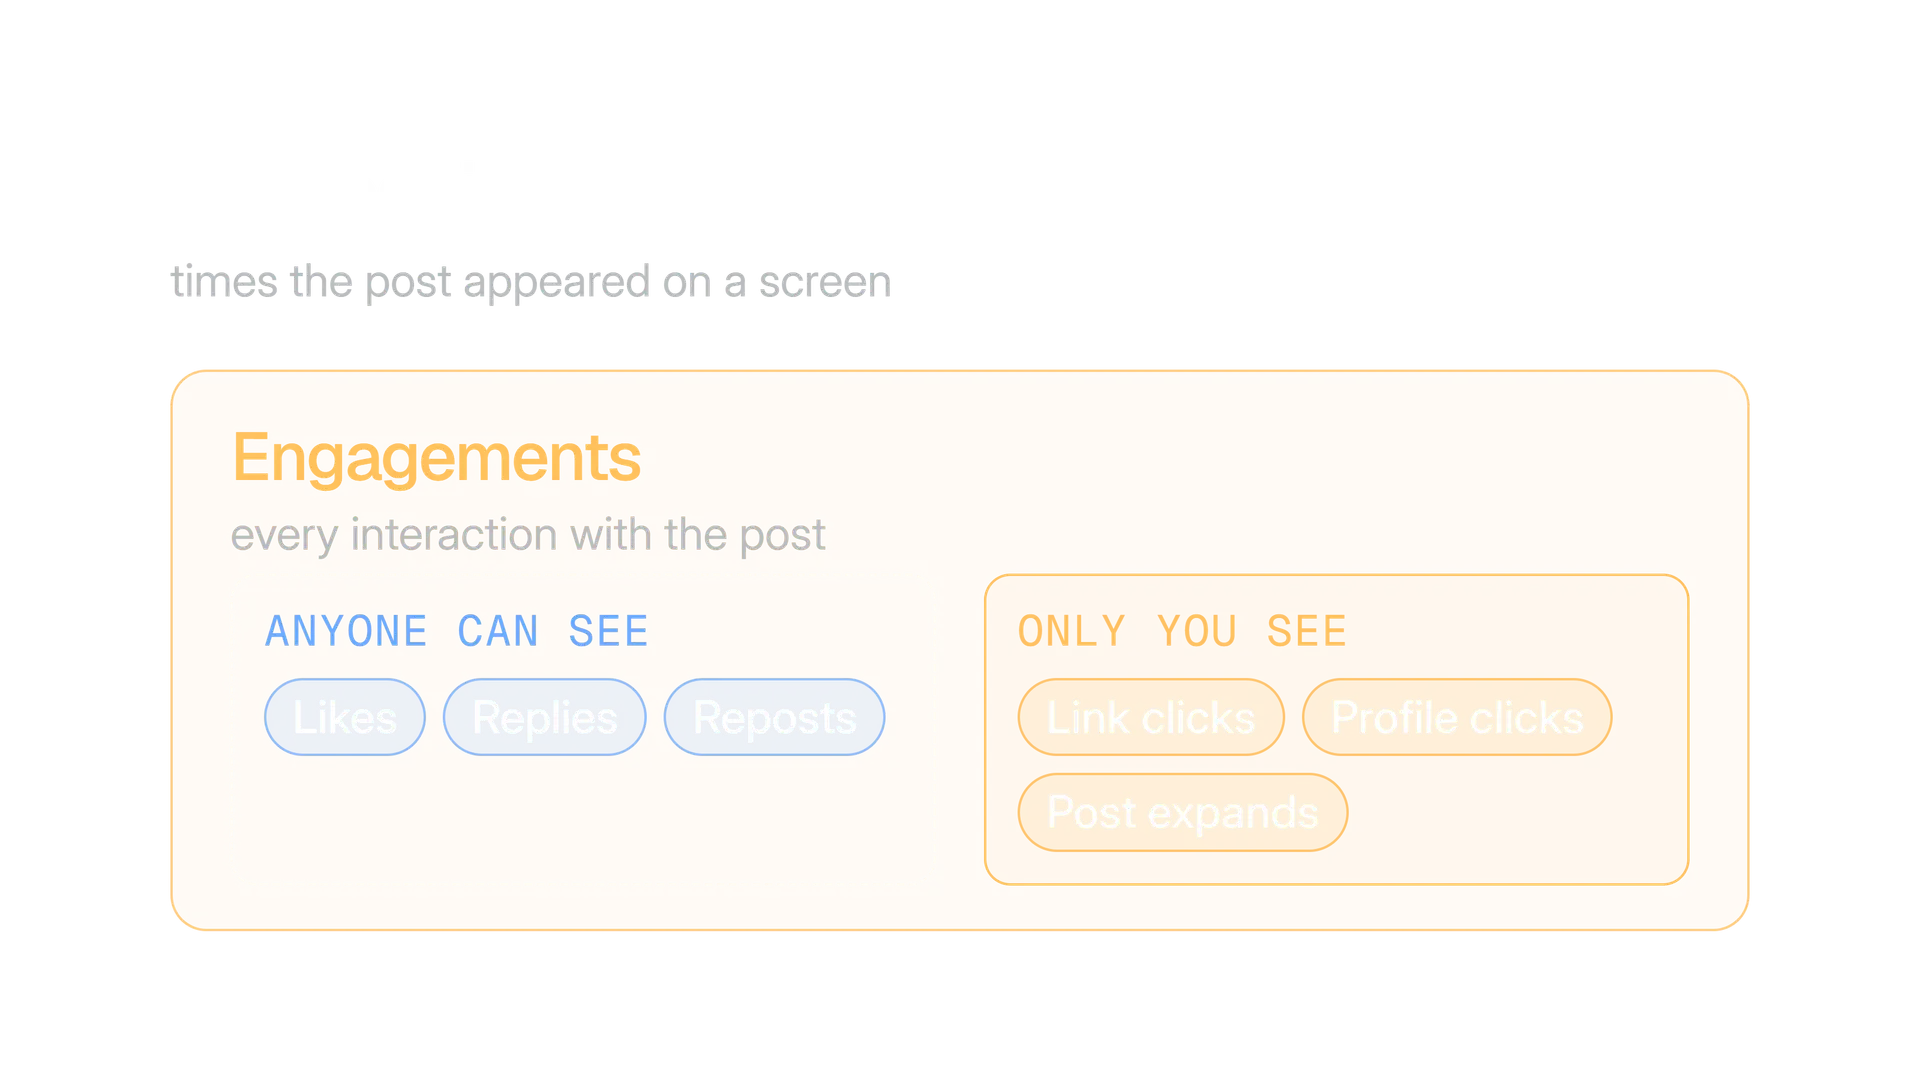
Here is how that reads on a single made up post.
The autumn beans land on Thursday. We wrote down how to brew them three ways: example.com/autumn
Say the post shows 2,400 impressions and 72 engagements. The engagement rate is 72 ÷ 2,400 × 100, which is 3.0%. If 18 of those 72 engagements were clicks on the link, the link click rate is 18 ÷ 2,400, or 0.75%, and the link clicks are already inside the 72.
The full method, including the choice between dividing by impressions or by followers, is in our guide to calculating engagement rate on X.
Which number answers which question
- Was it shown? Impressions.
- Did people react? Engagement rate by impressions.
- Did it send traffic? Link clicks first, then sessions in your web analytics.
- Did it build the audience? Profile visits, then followers.
- Did a video hold attention? The playback milestones, which are unique users who played through 25, 50, 75 and 100 per cent. Our video on X guide covers formats.
How the Post Activity Dashboard and CSV export work
The Post Activity Dashboard lists your posts with their impressions, engagements and an engagement rate, and it can export a CSV. As X's help page reads in October 2026, it opens on the last 28 days and you can change the date range.
28 days
shown by default
X Business Help, Post and Video Activity Dashboards
30 days
in one CSV export
X Business Help, Post and Video Activity Dashboards
3,000
posts per export, replies included
X Business Help, Post and Video Activity Dashboards
36 hours
for numbers to stabilise
X Business Help, Post and Video Activity Dashboards
The Video Activity Dashboard works the same way for video, and X says both can export a file with post level data and permalinks, split into organic and promoted metrics. The 36 hours matters: X says its systems take up to that long to stabilise, so a slight fluctuation is normal.
A clean export takes six steps.
Pick one date range
Choose the dates the post went out, up to 30 days at a time. For a month, export the whole month, not the last 28 days.
Export the CSV
If you reply a lot, replies count towards the 3,000 post cap. X suggests splitting a long range into smaller ones when the file will not download.
Convert the times
The export is in UTC, so a post you sent at 9 in the morning may show at another hour. Convert to your own time zone before you compare slots.
Leave out the newest posts
Posts under 36 hours old are still settling. Better, wait until every post in the file is the same age, such as 7 days.
Keep organic and promoted apart
The file splits them. Add them together only if the report covers paid and unpaid posts as one.
Name the file by its range
Save it as
x_posts_2026_09.csvor similar, in a folder you own. This is the copy you will trust in a year.
What the X API shows, and why the 30 day window matters
The X API lets a program read the same kinds of counts. Public metrics cover any post. Non public metrics, which include URL clicks, profile clicks and the engagements total, are only for your own posts, and X says they are only available for posts created within the last 30 days.
That window is the single most important API fact for reporting. After day 30, the private counts for that post are no longer there to read. Three reporting guides go further: measuring brand awareness, measuring community health and reporting results to executives.
X's developer docs sort the metrics like this.
| Kind | Who can read it | What is in it | Window |
|---|---|---|---|
| Public | Anyone with API access, for any post | Impressions, likes, replies, reposts (quotes counted separately), quotes, bookmarks, video views | No 30 day limit stated on the metrics page |
| Non public | The post's owner, with user context | URL clicks, profile clicks, engagements, video playback milestones | Posts created in the last 30 days |
| Organic and promoted | The post's owner, with user context | Counts split by whether they came from unpaid or promoted delivery | Posts created in the last 30 days |
The docs also describe a Get Posts Analytics endpoint, and a handful of facts shape how you use the API.
- What you send. Up to 100 post IDs and a start and end time, with results by hour, day, week or in total.
- What comes back. Fields such as impressions, engagements, likes, replies, bookmarks, detail expands, URL clicks, profile clicks, media views, follows and unfollows.
- How far back. That page states no maximum look back, and the metrics page states 30 days, so we plan for the shorter one.
- No rate field. The metrics page lists counts only. You divide them yourself, as in our engagement rate guide.
- Followers is a running total. The API gives the current followers count on a user. To see growth, save the count on the same day each month.
Reading through the API costs credits: X's docs say credits are bought in advance and deducted as requests are made.
Our posts on the X API and X API pricing explain how that works. If you would rather not build this, Kairo Post's analytics read post and account metrics from the official X API, and because X charges for reading post metrics, you choose how often they refresh and see the price first.
What X analytics does not show
X analytics does not show who saw your post, what people did on your website afterwards, or the private numbers of other accounts. Knowing the gaps stops you drawing conclusions the data cannot hold.
- People. An impression is a view, not a viewer. We found no unique viewer count for organic posts on the pages we read.
- Your website. X records the click. What happens on your site, such as how long people stay or whether they buy, is visible only to your own analytics.
- Other accounts' private numbers. Link clicks, profile clicks and engagements need user context and are for your own posts.
- Old private counts through the API. After 30 days the non public metrics for a post are gone from the API.
- A finished rate. The API lists counts and no engagement rate, so the rate in a report is always one somebody calculated.
- A reason. X shows what happened to a post, not why. The why comes from comparing posts you changed on purpose.
Things we could not confirm from X's own pages
We tried to confirm these and could not, so we do not state them as facts.
- The exact menu path to open analytics in the X app and on the web.
- Which accounts or plans see which views. Third party pages disagree, and X's pages we could read do not settle it.
- How long Account home looks back. Excerpts of X's help say the past month in one place and 28 days in another.
- Whether the engagements total counts bookmarks and quotes. The definition names clicks, reposts, replies, follows and likes.
- Whether repeat clicks from one person count once or twice, and whether X filters bots.
If a post of ours depends on one of these, it says so. Open the pages in the sources list and read them yourself.
How often to check each number
You do not need every number every day. Match the check to how fast the number moves and what you would do about it. Most accounts need a short weekly look and one proper review a month.
| How often | What to look at | What you would do |
|---|---|---|
| Weekly, five minutes | Impressions and engagements for the week, any post far outside your normal range | Note it. Do not change strategy on one week |
| Monthly, under an hour | The six numbers, the top and bottom post, link clicks against sessions | Write the report and pick one change |
| Every quarter | Your baseline: the median of your last 20 to 30 posts | Reset the baseline and drop old posts from it |
| Before day 30 of any post | Private counts you want to keep, if you read through the API | Copy them into your own sheet |
Profile visits and followers deserve one extra habit. Read them together. Profile visits show how many people looked at you, and followers show how many of those stayed. If visits climb and followers do not, the posts are interesting but the profile is not finishing the job. Our profile optimisation guide covers what visitors see.
Followers also need a growth rate, not just a total. Subtract the followers at the start of the month from the followers at the end, then divide by the start. In the example later, 142 new followers on 3,120 is 4.6%. A total of 3,262 on its own cannot tell you whether that was a good month.
How to find your own baseline
Your baseline is what a normal post of yours does, measured the same way each time. Take the median engagement rate of your last 20 to 30 posts, all read at the same age. A new post is then "above", "near" or "below" normal, which a single number cannot tell you.
We give no average engagement rate for X here, on purpose. We found none from X, and none from research that discloses its method and sample.
List 20 to 30 recent posts
Use the export, so the numbers share a source. Leave out giveaways and paid posts if they are not your normal output.
Pick one measuring age
Read every post at the same age, such as 7 days after it went out. Which age matters less than keeping it fixed.
Work out each post's rate by impressions
Engagements divided by impressions, times 100. Write the formula at the top of the sheet.
Take the median and the middle half
The median is the middle value. The range from the lower to the upper quarter shows how much a normal post varies.
Compare, then change one thing
A post above the middle half beat your normal. Test one change at a time, so you know what caused it.
Our free engagement rate calculator does this for a pasted list of posts. The median beats the average because one very good post drags an average up, and a median does not move.
When your baseline settles, it also gives you something to report that does not depend on anyone else's account.
How to track clicks from X to your website
To track clicks from X, put UTM tags on every link you post, then compare X's link clicks for each post with the sessions your web analytics shows for that tag. The two counts measure different things, so they will not match. Our guide to tracking clicks from X has the full method.
Google asks you to always use utm_source, utm_medium and utm_campaign. Values are case sensitive, so x and X become two sources. A tagged link for an X post looks like this:
https://example.com/autumn?utm_source=x&utm_medium=social&utm_campaign=autumn_launch&utm_content=post_01
| What X shows | What your website analytics shows |
|---|---|
| Link clicks on a post | Sessions that arrived with your tag |
| Counted by X, per post | Counted by your tool, per tag |
| Can include clicks where the page never finished loading | Only visits where your tracking loaded |
| Found in the dashboard and CSV | Found in GA4 under Acquisition, Traffic acquisition |
Build the tags with the free UTM builder, which lowercases values and has presets for a post, a thread and a profile link. Use the same names every month, because a report that changes its labels cannot be compared with last month's. To compare two versions of a post without fooling yourself, see how to A/B test X posts fairly.
How to build a simple monthly X report
A good monthly report fits on one page: six numbers, one line on what changed, one line on what you will do next. Anything longer is read once. Here is a routine that takes under an hour once you have done it twice.
Export the month
On the first working day of the month, export last month's posts. Wait until the newest posts are at your measuring age if you can.
Fill in the six numbers
The six metrics from earlier: impressions, engagements, engagement rate, profile visits, link clicks and followers at the start and end of the month. Add posts published and the sessions from your tagged links as context.
Put each number next to a comparison
Last month and your baseline. A number alone tells nobody anything.
Pick one post that beat your baseline and one that fell short
Link both. Write one line each on what you think made the difference.
Write the decision
One sentence: what you will keep, change or stop next month.
Save the report next to the export
Same folder, same file name pattern. In six months you can read the whole story in order.
Here is what the numbers might look like. The account and every figure are made up.
| Example: Harbour Roasters, September | Value | How it is worked out |
|---|---|---|
| Posts published | 38 | Counted from the export |
| Impressions | 96,400 | Sum of the month's posts |
| Engagements | 2,890 | Sum of the month's posts |
| Engagement rate, pooled | 3.0% | 2,890 ÷ 96,400 × 100 |
| Median post rate | 2.7% | Middle value of the 38 post rates |
| Profile visits | 1,240 | Read from your account analytics; note the dates it covers |
| Followers | 3,120 to 3,262 | Up 142, or 4.6% |
| Link clicks on X | 410 | Dashboard total |
| Sessions from tagged links | 335 | 82% of the link clicks |
The pooled rate sits above the median because a few strong posts carried the month, a pattern worth a line in the report.
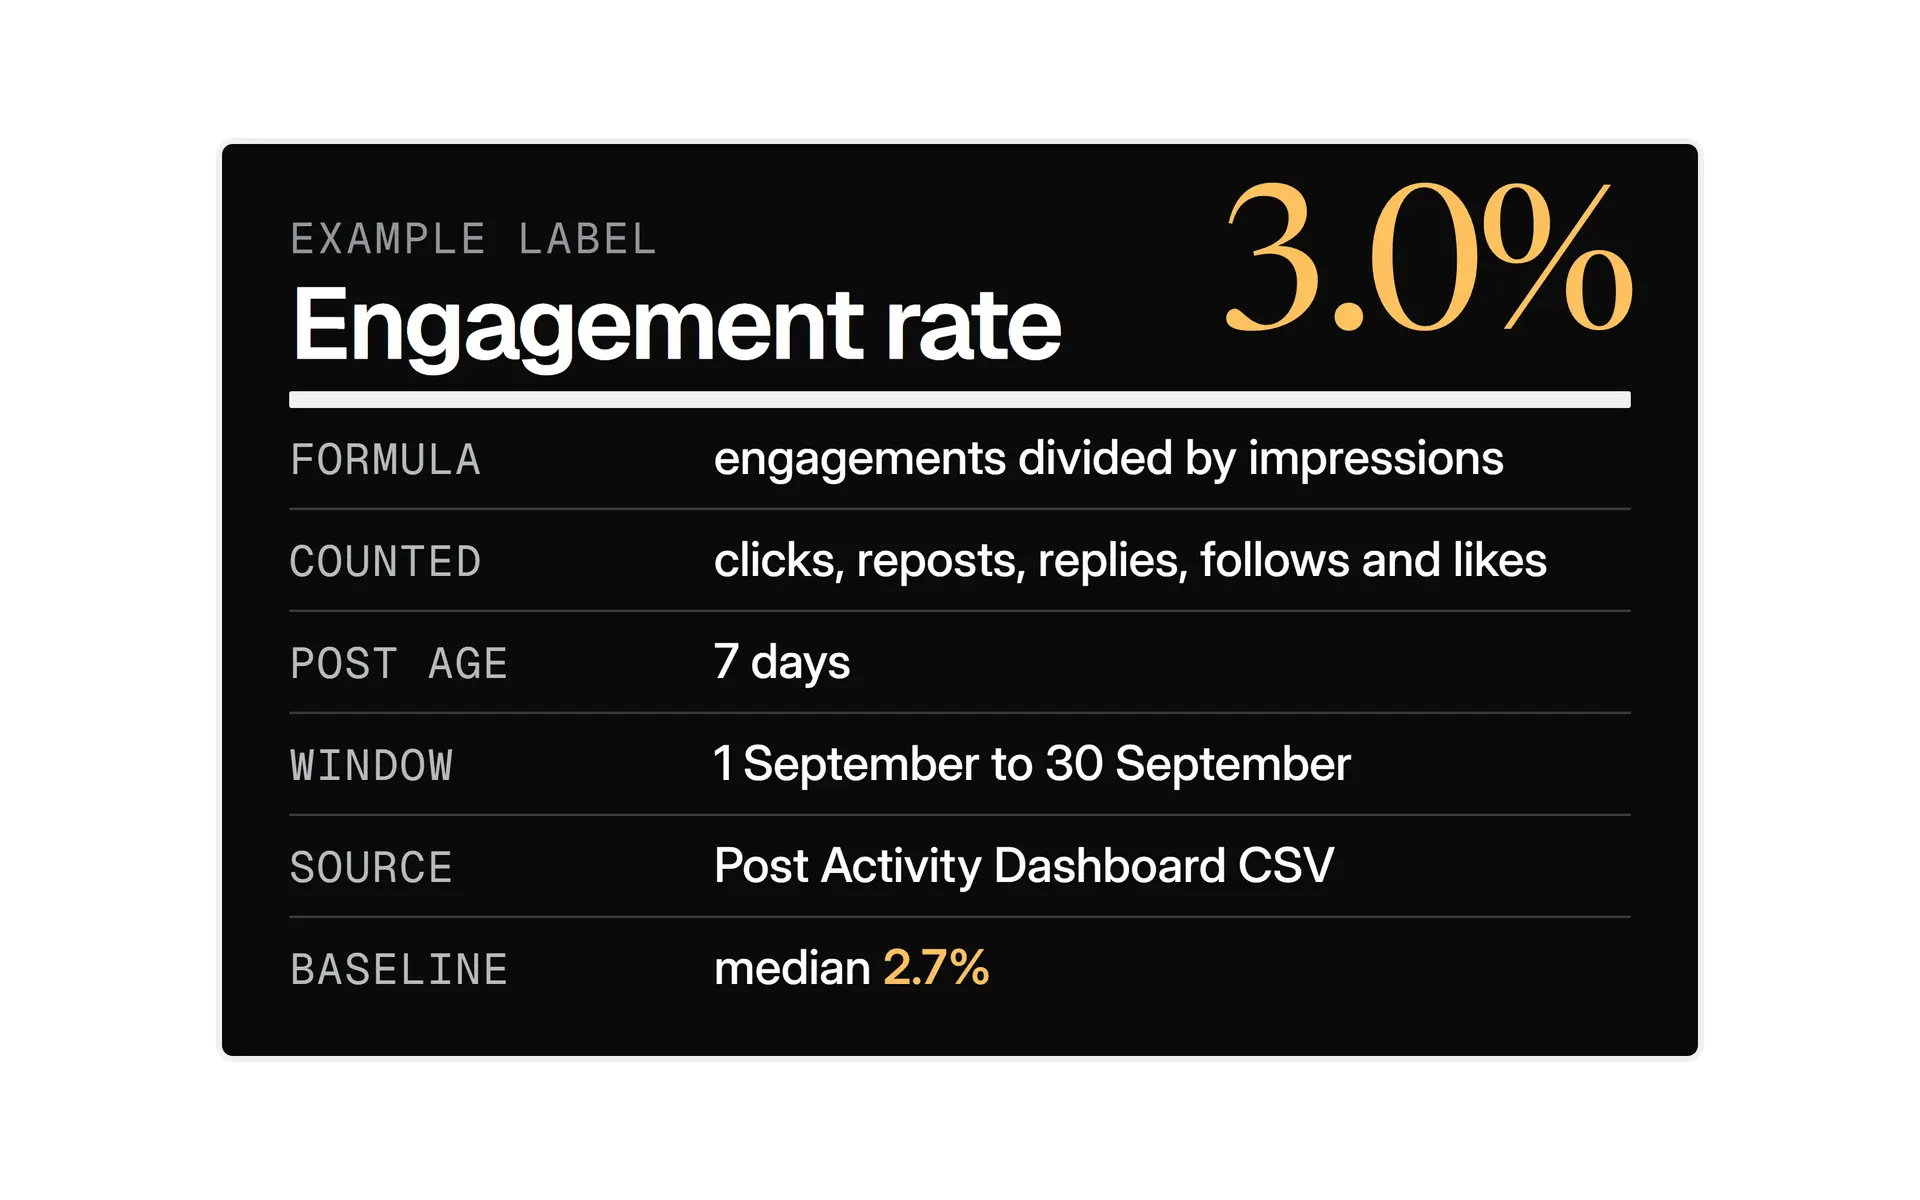
If you manage accounts for others, the guide to managing X for clients covers the wider routine. If you want a regular report, Kairo Post can save a daily or weekly one as a private file you can share.
What to do when a post beats or misses your baseline
Treat one unusual post as a lead to follow, not a verdict. The first job is to rule out a boring explanation, and the second is to find what was different about the post.
| A post far above your baseline | A post far below your baseline |
|---|---|
| Check the age. Is it being compared at the same age as the others? | Check the age. Is it still inside the settling period? |
| Split the lift. Did impressions rise, or did the rate rise? | Split the drop. Were impressions low, or was the rate low? |
| Write down what was different: topic, format, hour, opener | Write down the same four things, without blame |
| Repeat the idea once on purpose before you call it a pattern | Try the topic once more in a different format before you drop it |
The split in the second row matters most. A post can have a strong rate on few impressions, which says the idea landed with the people who saw it, or a weak rate on many impressions, which says it travelled to people who did not care. Those two cases call for different next steps, and the engagement rate alone hides the difference.
If you export a month of posts, sort the sheet by impressions, then by rate, and read the top and bottom five of each. You will usually see the same few differences repeating. That short list is worth more than any single number in the report, and our guide to how the X algorithm works covers what X has published about how posts are shown.
Mistakes that make X analytics misleading
Most bad readings of analytics come from comparing numbers that were never comparable. These are the ones we would check first.
Age
Reading too early
Numbers keep moving, and X says its systems take up to 36 hours to stabilise. Compare posts at the same age.
Method
Mixing formulas
Engagement rate by impressions and by followers can differ by several times. Write the formula at the top of every sheet.
Months
Counting by the wrong date
X's page on analytics discrepancies gives this example: likes that arrive in April on a January post do not show in April's CSV. Decide which date your report goes by and say so.
Traffic
Treating clicks as visits
X's page also lists poor connections and slow loading among the reasons X and a third party tool can disagree. Expect a gap.
Targets
Chasing a benchmark
Someone else's average describes someone else's audience. Your own median describes yours.
Samples
Judging one post
A single post, especially from a small account, swings widely. Judge a pattern across 20 or more.
The way you write a result matters as much as the reading. Compare these two lines for the same made up month.
A line someone can check
Engagement rate by impressions, read 7 days after posting, was 3.1% against a baseline median of 2.8%. We tested a shorter opener on 8 posts.
A line nobody can use
Engagement is up and the account is growing nicely this month, so we are going to keep doing more of the same.
The first line names the formula, the age, the baseline and the change. The second says nothing that next month's report could be checked against.
Your next step: a 30 minute analytics setup
Do this once and the monthly report gets much easier. It also gives you a record that survives the 30 day limit.
Set up in one sitting
- Open the analytics in your account and note which views you can see.
- Choose one measuring age, such as 7 days, and write it down.
- Export last month's posts and save the file with its date range in the name.
- Work out the median rate of your last 20 to 30 posts. That is your baseline.
- Create the six number sheet and fill in last month as a first row.
- Tag every link in your next posts with the same names each time.
- Put a monthly reminder in your calendar for the first working day.
From here, our guide to growing on X and the X content strategy show how to act on what the numbers say. If you plan content around topics, content pillars for X gives you a way to see which topic earns its place.
In the product
How Kairo Post does this
Everything above works by hand. Kairo Post does the same work for you, with your approval before anything goes out.
Questions people ask
Can I see X analytics for a client's account?
Why do my X analytics numbers keep changing?
Can I see analytics for someone else's posts?
How long does X keep my analytics?
Does X show how many different people saw my post?
How often should I check my X analytics?
Do I need a third party analytics tool for X?
Sources
Every rule, limit and figure in this post was checked against these on the date shown.
- Metrics, X Developer Platform
docs.x.com · checked
- X API v2 data dictionary, X Developer Platform
docs.x.com · checked
- Get Posts Analytics, X Developer Platform
docs.x.com · checked
- Post and Video Activity Dashboards, X Business Help
business.x.com · checked
- Common analytics discrepancies, X Business Help
business.x.com · checked
- Export CSV Definitions, X Help Center
help.x.com · checked
- X Ads glossary, X Business Help
business.x.com · checked
- How to use the Delegate feature, X Help Center
help.x.com · checked
- Pricing, X Developer Platform
docs.x.com · checked
- Collect campaign data with custom URLs, Analytics Help
support.google.com · checked
Written by